Planning During the Indefinite Green Phase
These supplemental movies and figures correspond to Example 1 of the following paper:
Planning During the Indefinite Green Phase:
These supplemental figures correspond to Example 1 in the Optimal Driving manuscript.
- Planning begins at \(t = T_G\).
- The driver faces no restrictions other than the speed limit.
- The process terminates once the driver arrives at \(d = \bar{d}\).
Feedback Controls and Trajectory Tracing:
- Traces optimal trajectories starting from \((d,v) = (80, 0)\) for two different sets of objective preferences.
- \(t = 0\) in the animation corresponds to \(t = T_G\).
- The black dot in both animations corresponds to \((d,v) = (80, 0)\).
- These animations highlight how different objective preferences will affect how much time the driver spends in each of the three stages of the optimal trajectory (See manuscript Section V, Example 1 for a description of the stages.).
\((c_1,c_2,c_3) = (0.025, 0.025, 0.95)\):
\((c_1,c_2,c_3) = (1/3, 1/3, 1/3)\)
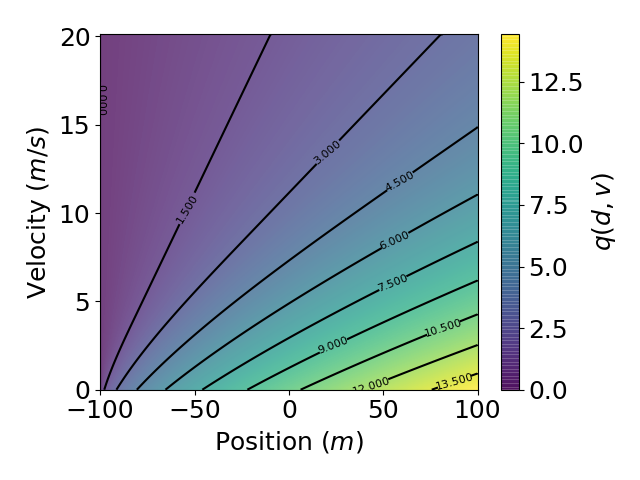
Value Function Contours:
- Contour plots of the value function \(q(d,v)\) at each point in the domain.
\((c_1,c_2,c_3) = (0.025, 0.025, 0.95)\):
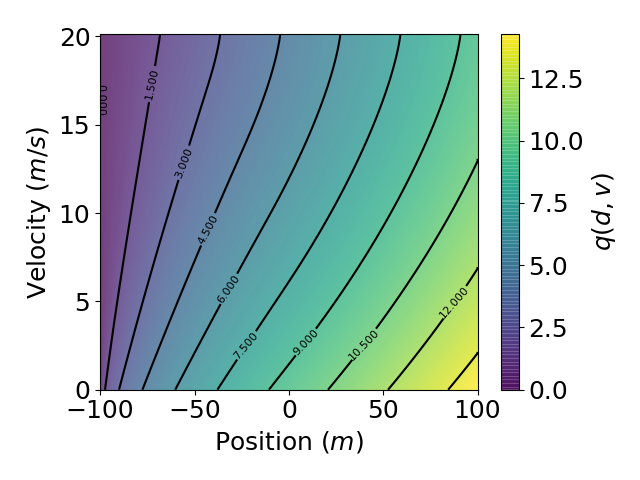
\((c_1,c_2,c_3) = (1/3, 1/3, 1/3)\)